Ruin

Within statistics the problem of ruin is well known. Imagine that one in twenty plays in a casino lead to financial ruin, i.e. you lose everything you have. That would mean that if twenty people play one night, one of them would probably be financially ruined. Or, to make matters worse, if you play for twenty rounds, it is highly likely that you will be financially ruined. 

How is this relevant for football clubs? Well, in most leagues we have eighteen, sometimes twenty clubs. Each year a couple of clubs are relegated. Relegation in most leagues means something close to financial ruin. Especially, if the club is unable to be promoted straight away in the next season. Even though clubs being relegated from the Premier League get financial support, if you look at the names in the Championship, you can see some pretty well known clubs like Watford, Stoke and Huddersfield. What happened?

The point is that even quite a low probability of hiring bad players, gives you quite a high chance of being relegated once every twenty years or so. Of course, for clubs who have less budget this chance is much bigger as they have a higher probability that they hire lesser players. Especially if they have just been promoted. And thanks to the winter transfer season, rich clubs have the opportunity to go on a spending spree and repair the damage of the original bad hires.

Yet, it goes to show how important good decision making is when it comes to hiring players. The problem of ruin shows that small mistakes can have big consequences. The best way to do risk management is to get as many different scouts, data sources and consultants to agree on the player to hire. The more disagreements the bigger the risk. At the same time, it is important to make sure that different data sources are indeed different and not just presenting the same data in different formats. The same goes for live, video and live scouts. If they suffer from the same biases then the risk increases. If the head of scouting or the head of recruitment is a dominating person it is well possible that he forces the group into group thinking, again increasing the risk of bad hires.

Scouts get a lot of social status as working for a club. Often it is hard to see whether the success of hired players is a matter of scouting skill or happenstance, i..e. luck. If lucky guesses give a club too much confidence in only a few opinions, then again risk increases. All of these small increments to the overall risk, also increase the probability of ruin. It might not happen for decades, but all of a sudden a famous club is relegated and they are in big financial problems. Only because they thought that had the risk of bad hires under control where in reality there still was a small chance of hiring bad players. Unfortunately, even small chances lead to ruin in the long term.

Subjectivity

Everything is subjective. Nothing is objective. People mistake high convergence for objectivity. Everything you see, hear and feel is subjective. It is your brain who creates your subjective experience. You have a Bayesian brain that creates expectations on the one hand and processes sense data on the other.

Given that everything you read and all the stories you hear, are also part of your subjective experience, there is no way to escape subjectivity. Nor is there a need to escape it. Everything you want to achieve with objectivity can be achieved with convergence.

That a ball shot in the air, falls back to the ground is not an objective truth, but only we can all agree on. So this is an example of high convergence.

That it is extremely unlikely that a ball once shot in the air, will continue to hover in the air, is again not objectively the case. It is only another example of high convergence.

That flipping a coin will have a 50% chance of heads, is not an objective truth, but again only an example of high convergence.

In every case where someone might want to use the label “objective”, in reality it only means high convergence.

But there is way less convergence on whether Manchester City is going to win the Champions League this season. So no matter whether you agree or disagree, your viewpoint is considered more subjective and less objective. In reality there is no difference to the level of subjectivity (all statements and situations are completely subjective), there is only a difference in the level of convergence.

The higher the convergence, the more people mistake that high convergence for objectivity. The lower the convergence, the more people mistake that low convergence for subjectivity. Again, in reality there is only subjectivity and high or low convergence. There is no objectivity.

Subjectivity in football

In almost all cases there is a very high correlation between the level of convergence and whether people consider something, wrongly, subjective or objective. But this is less the case in football. Although there is very high convergence on match dates, teams involved in the match and the final outcome and result, there is way less convergence on almost everything else.

Many data providers claim to be objective. This is not the case at all, as we have seen. The best they could claim is that there is high convergence on their data. That is one of the reasons why the present themselves as objective and why they are so vigorously trying to convert people to adapt their way of looking at football. But in reality there is way less convergence about almost all their data. 

Let’s look at passing. Can you objectively count all the passes in a match? No you can’t. First of all because there is no such thing as objectivity. But more importantly, to count passes you first have to define what a pass is. The easy way to see how much subjectivity there is in pass counting, is to try and define a cross pass, long pass or key pass. Depending on your definition you get a different count. Other people might disagree with your definition and thereby decreasing convergence. But even if they agree with your definition, they might disagree as which passes fall within your definitions and which fall outside of them, thereby decreasing convergence even further.

Even if you only look at simple passes there are tricky situations. Do you allow for passing to yourself? If not, would a pass to yourself then be considered a dribble? Again, all grounds for disagreement and a further decrease of convergence. Can I pass to another player by ricocheting the ball of an opponent? Would that still be counted as a pass or not? As you can see even such seemingly simple task as counting passes, leads to disagreement and a decrease of convergence.

Where passes are relatively easy, things get even more complicated when trying to count duels, interrupts or interceptions. But then we can even go to a higher level to find more disagreement by asking: is it really smart to count? Or should we weigh of judge players actions? And then we can look at a game at an even higher level and ask the question: are actions really important or do we need to look at results and player contributions to those results instead? 

It doesn’t matter how you answer these questions. What matters is that within football many people come up with different answers. There is a lot of disagreement in football. That is a good thing by the way, because it makes football a very interesting activity. If we would all agree on everything than everybody would play the same and football would be much more boring. So disagreeing about these kinds of questions is a good thing! Yet, at the same time these differences also make clear how much disagreement there is and how little convergence

To sum up: everything is subjective, but our ideas about some things have a high convergence. This high convergence is often mistaken for objectivity. But in football we might even be wrong about the level of convergence. Convergence in football is much lower than some people assume. And that is a good thing: it makes football very interesting.

System

In football there is a lot of talk about systems. But what is a system? Thinking in terms of systems started with cybernetics during World War II. Where Turing was busy inventing the digital computer that we still use today as our PCs and our phones are Turing machines, the cybernetic group tried to invent an analogue computer. Their task was to come up with a guidance system that would help anti-aircraft guns shoot down German fighter planes. The German jet fighters flew so fast that if you aimed and shot at where they were, by the time the bullet reached that spot the plane would be gone. So one needed to use probability calculations to determine the most likely spot where the plane would be and shoot at that spot so that the bullet and the plane would reach that spot at the same time.

The cyberneticians of that period tried to achieve this with chemical and natural processes that would use feedback loops. Unfortunately, they were never able to achieve this goal. But fortunately to compensate for the lack of practical progress, they made a lot of progress in information theory. Cybernetics became so successful helping organizing information systems in the fifties and sixties that more and more branches in sciences started to use cybernetics. Nowadays this has resulted in data science, cognitive science, neuroscience and philosophy (in the form of enactivism) now use cybernetics to understand their subject. See for instance Cybernetic Big Five Theory as the best explanation of the personality of players. Thinking in terms of a system is the main concept that has made cybernetics so attractive. Together with process feedback.

What is a system according to cybernetics?

First of all you are completely free to subjectively decide what the boundaries of your system are. Once you have decided on the boundaries of the system, you would then treat the system as a black box. A black box approach means that you don’t really care what is inside the box. The only thing that you care about is how many ways you have to manipulate the system. And how these manipulations change the external behavior of the system. Once you have that down, then you can create a matrix of how the output of the system depends on changes to the input. This matrix gives you the number of variables that influence the system and the number of different values these variables can contain. Variables to the power of the number of different values these variables can have, determines the variation a system can have. The higher the variation, the higher the complexity of the system. Cybernetics has a lot to say about how much communication is possible between two systems depending on how much variation they can handle

With your system thusly defined, you can do all kinds of wonderful things. First of all, you can open the black box of your system by dividing your system into smaller systems. Now your black box has become a muddy box as you know more about what is happening inside your black box. Cyberneticians have done this all the way to the level of brain cells! 

At the same time if you can divide a system into smaller subsystems, you can couple two or more systems to create a new higher level system. Again, this higher level system is not a black box, but a muddy box because you know something about what is happening inside the higher level system. Cyberenticians have used this to couple for instance coach and coachee, or a team or even a whole organization.

How does this apply to football?

System talk is always highly abstract. So let’s see whether we can make it more concrete for football. First of all, the most obvious system we can define is the player himself. Humans are almost always considered a cybernetic system. We already know one subsystem of a player, i.e. his personality. But modern neuroscience considers the brain to be a cybernetic system.

Of course, system thinking in football is more interesting when we scale up rather than scale down. With the player as our basic system, we can then go on to define our defensive system as the coupling of the keeper and the defenders, our midfield system by coupling the defenders and our attacking system by coupling all defenders. From here it is quite a small step to go into formations.

Interesting enough, players that score high on transitioning contribution increase variation and complexity. If you combine those players with players that score high on attacking contribution so you have players that can finish the job, you increase the attacking strength of the team. As a rule of thumb you can say that higher complexity increases your chances to score, but you also increase your risk of the opposing team scoring. To lower the risk of the opposing team scoring, you decrease complexity by defending. Adding players who score high on defending contribution you are able to decrease complexity while defending, making it harder for your opponent to score. Then, once you have captured the ball, you increase complexity again in order to make it easier for your team to score. As you can see players who score high on all three contributions (attacking, defending and transitioning) are the most valuable players.

To see more applications of cybernetic systems, see the entry on feedback. There you’ll find the cyberentic cycle that describes any goal oriented system like football.

The next step in scaling up is the system becoming the whole match. At all levels a system is only cybernetic if it can be described with the cybernetic cycle. The cybernetic cycle has six steps to it:

  1. Select a goal.
  2. Select an action to achieve this goal.
  3. Execute the selected action.
  4. Interpret the results of the executed action.
  5. Compare the interpreted result with the selected goal.
  6. If the selected goal is achieved or achieving this goal takes too much time, go back to step 1. Otherwise, go back to step 2.

So if we take the whole match to be a system, then first goal our team selects is to win by scoring more goals. So the first action we decide to undertake is to attack. Then we actually attack. To be followed by interpreting the result of our attack. If we lose the ball we compare the result of our action with our goal. We did not achieve our goal so we select a new action to achieve our goal, which is to win the ball back. If we succeed at recapturing the ball, we still haven’t achieved our goal, so we select a new action, which is to attack again. We continue to do so until either we have won the match or not.

Tautology

A tautology is a statement that is always true because it basically affirms itself. “A bachelor is an unmarried man” if often quoted as an example of a tautology. Bachelor and unmarried are basically two different ways to say the same thing.

All true statements in formal logic and mathematics are tautologies. So “2+2=4” is a tautology because if you look at set theory that is the underlying mathematical structure of “2+2=4” you can see that both sides of the “=” are basically the same. So within formal logic and mathematics, tautologies are very useful. Because, although all the information that you get with a tautology in formal logic or mathematics was already there, we limited humans learn new ways to make use of mathematics and formal logic this way. So we actually learn something.

This is not the case outside of formal logic or mathematics. In the real world you don’t learn anything from a tautology. If you know both words “bachelor” and “unmarried’, you don’t learn anything when I tell you that a bachelor is actually also unmarried. You already knew that when you learned the word “bachelor”. So while tautologies have limited use when used in mathematics and formal logic, they are pointless in the real world.

For football this means that it is important to avoid tautologies everywhere, especially in an analysis. Here is an example of using a tautology to come to a conclusion (which is pointless):

“All in all, Nagelsmann’s Leipzig were capable of winning against Marco Rose’s Gladbach due to their effectiveness in the first half as well as their counter-attacking threat throughout the whole game. Leipzig overall created much bigger opportunities and therefore also deserved the win as the xG values prove.”

Source

Can you spot the tautology? In the real world they are harder to spot because we don’t use the “=” sign. The tautology in the above quote is that Leipzig won due to their effectiveness. Not only is this a cause and effect statement with all issues of those kind of statements, but is also a tautology. This is due to the fact that effectiveness in football means winning. Nobody writes “Gladbach lost due to their effectiveness”. That is a really weird sentence. In philosophy we call these sentences “deviant sentences” because we intuitively know that there is something wrong with these kind of sentences, even though they are grammatically correct. The best example is “The submarine swam through the sea.” It is grammatically correct, but nevertheless very wrong.

The same goes for “Gladbach lost due to their effectiveness”. But here the reason why this sentence is deviant, is that effectiveness so closely related to winning that it makes no sense to link it to losing. But given that effectiveness is so closely related to winning, claiming that a team won because of its effectiveness is a tautology that doesn’t inform us of anything.

Thinking sport

Football is much more of a thinking sport than a doing sport. Good examples of a doing sport are athletics or gymnastics. Doing sports are more about physical prowess and lack an element of gaming. Thinking sports are more often team sports and have matches where you play against each other. So a thinking sport has many more elements of a game.

The thinking part of a thinking sport is mainly pattern recognition. Most of the time this happens unconsciously and players react directly on recognized patterns. Given that the brain only has three ways to learn these patterns (imprinting, associative learning and instrumental learning), for the most part recognizing the right patterns has to do with having a rich associative model of football inside your brain. To be clear: the brain doesn’t really have a model, but the easiest way to understand how the brain stores learnings, is to think of all the learning as a model of the world. Specific learning about football then creates a football model. In the same way that everything stored in the brain about the player himself, creates the person as football player model. If a coach enriches these models suddenly the player is capable of more.

Although pattern recognition is for the most part build on game intelligence acquired through associative learning, technique (acquired through instrumental learning) also plays its part. For being able to recognize a pattern is one thing, being able to act upon the recognition in such a way that it is to the advantage of a team, is another. If a player fails to make a play, good scouts always ask themselves whether this was due to the fact that the player didn’t recognize the right pattern because he lacks game intelligence, or whether he saw the right pattern but lacked the technical ability to execute the right action for that pattern because he lacks technique. As in most cases, it is easier to teach a player technique that game intelligence, players lacking in technique, but who have good game intelligence, are often more interesting for scouts, than players who have excellent technique, but lack game intelligence. Another clear indication that football is primarily a thinking sport.

Underdetermination

Every theory is underdetermined by the data. This means that any set of data can prove multiple theories. In fact there will always be more than one theory that is supported by the data, no matter how much data you collect.  Underdetermination means that there is some determination by the data but not enough to exclude all other theories. Underdetermination does not mean that no theories are excluded. In fact, most of the time many theories are excluded. It is just that there will always be other theories that are also supported by the data besides your theory.

This is important for football in the following way. When an analyst does opposition analysis for an upcoming match for instance, that is in fact a theory that he is trying to substantiate with data. So if an analyst comes up with only a single prediction of what is going to happen, he misses that the same set of data substantiates multiple theories. It would be much better if the analyst would describe several possible scenarios for the upcoming match with his probability estimation for each scenario. And if he would add the scenarios that he would exclude based on the data he collected. Or, if he can’t rule them out completely, at least describe which scenarios he finds very unlikely to happen coupled with the low probability estimations for those unlikely scenarios.

The same goes for scouts. No matter how much data a scout collects or how many video or live impressions he gets from the player (which is data in another format), there will always be multiple theories supported by this data. Data can exclude a player of being a viable option for the club because the chance of success is too low. But data (which includes impressions by the scouts themselves) can never absolutely guarantee that a player will be a success at the club. This has not only to do with a lack of data or human errors, but even if the club would have infaillible scouts and a perfect data set (which is impossible), even then every theory would still be underdetermined by the data. So also with scouting reports for players that have a high chance of success with the club, the scout already has to indicate what plan B would be if the player turns out to be less of a success than foreseen.

xG

xG stands for Expected Goals. xG is – as of this writing (4-10-2019) the hottest stat for football. xG basically calculates for a discrete number of positions the ratio of how many times a player has scored from that position and how many times players have shot from that position. Using Frequentism, people than equate xG with the chance to score from that position. This is only correct from the standpoint of Frequentism. If your frame of reference is Bayesian statistics then the frequency of scoring from a certain position is one of many things you can weigh in your judgement what the chance is for a particular player to score from that position against that particular opponent in that particular game. The lack of context is one of the criticisms that have been leveled against xG.

The following thought experiment demonstrates the importance of context. Say spot X has an xG of 0.5, meaning that 50% of shots taken from that position score a goal. If we found out that there were two evenly divided groups of players: group A and group B. If we then learn that players in group A always miss when shooting from spot X and that players in group B always score. Then we know exactly why spot X has an xG of 0.5. But it also makes clear that when a random player is shooting from spot X, there is much more value in knowing whether he belongs to group A or group B, then knowing the xG value of spot X. If you know the player is in group A, then you know he is going to miss. If you know the player is in group B, then you know he is going to score. The problem is that we don’t know whether a player is in group A or group B. We don’t even know which groups exist. xG is a way to compensate for this information. But football statistics would be a lot better if we were able to discern these groups and know which players belong to which group. In this way you can add more contextual information like the strength of the opposing team, time passed in the match or fatigue, for instance.

Nevertheless, the use of xG has been argued for by referring to the idea that xG has the highest correlations with other backward and forward looking statistics. First of all this is not the case. It is already known that the correlation of xG really only works in the top four leagues. For instance, in the Scottish football, shots on goal was a better stat to determine the winner than xG. My own research looking at the center forward of the clubs in the Dutch Eredivisie and the Belgium Jupiler Pro League only gave a 27% correlation with goals in the next season versus our own proprietary median FBM Attack score having a 50% correlation with future goals.

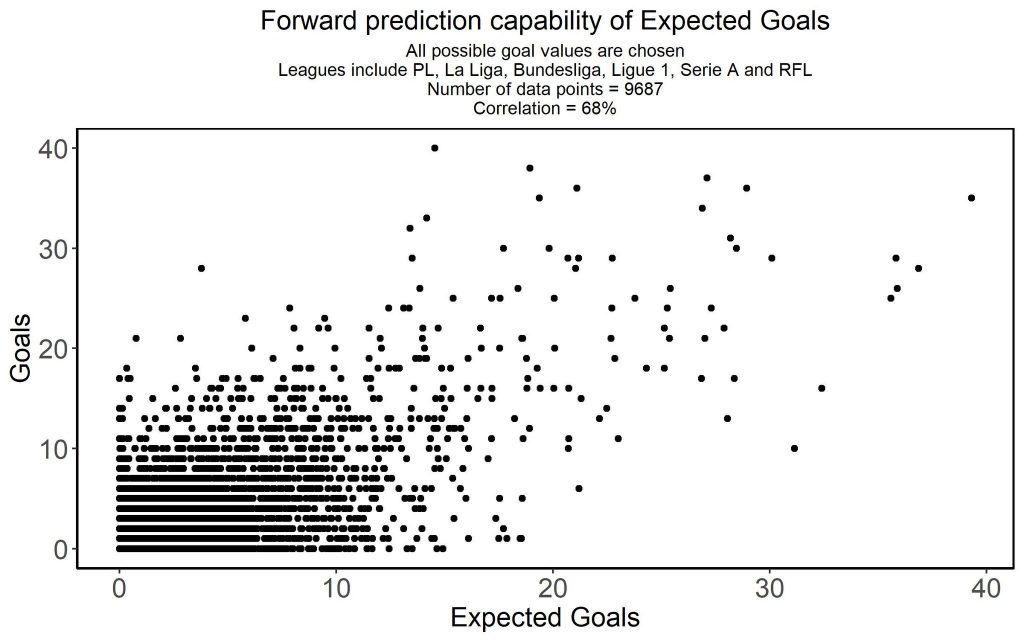
Since then quite a few people have calculated the correlation of xG and future goals in a number of different scenarios. Personally I am grateful to Ashes on Twitter for calculating different sets of correlations. Most people find that xG has a 68% correlation with the number of goals scored in the next season. Yet, there are many issues with correlation that make this number look more impressive than it really is as Ashes has been so kind as to help me demonstrate.

What is wrong with correlation and xG

The easiest problem with correlation is that any correlation below 80% carries very little information. Here are six diagrams showing you how much information there is, given a certain level of correlation:

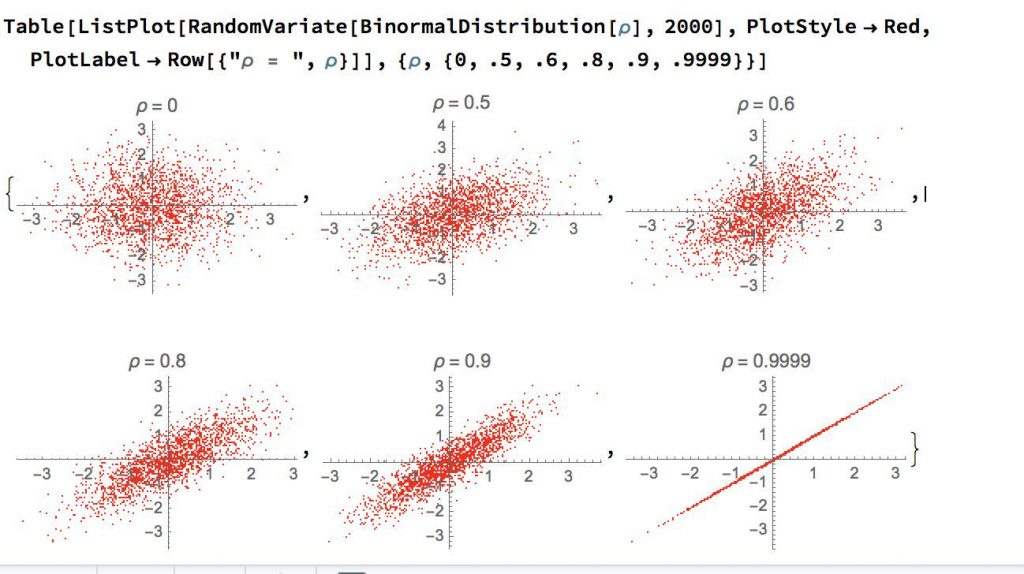
As you can see a correlation as high as 60% still carries very little information. That is the reason that although we found that our proprietary median FBM Attack score has a 50% correlation with future goals scored by the center forward of Belgian and Dutch clubs, we don’t use that to scout players as it would fool us. Yet, you can also see that a 27% correlation is also completely useless. So although there is a bit more information in a 68% correlation, the fact that it is below 80% makes it useless for decision making.

But the 68% correlation is misleading. Again, thanks to the work of Ashes, you can see that the 68% correlation is artificially inflated by combining the high correlation of low performing players, with the low correlation of high performing players. This issue has been discovered by Nassim Taleb in his criticism of IQ. What I have done with the help of Ashes, is apply the same principle to xG. Here are the results:

In the next chart Ashes only looks at players who have at least scored five goals:

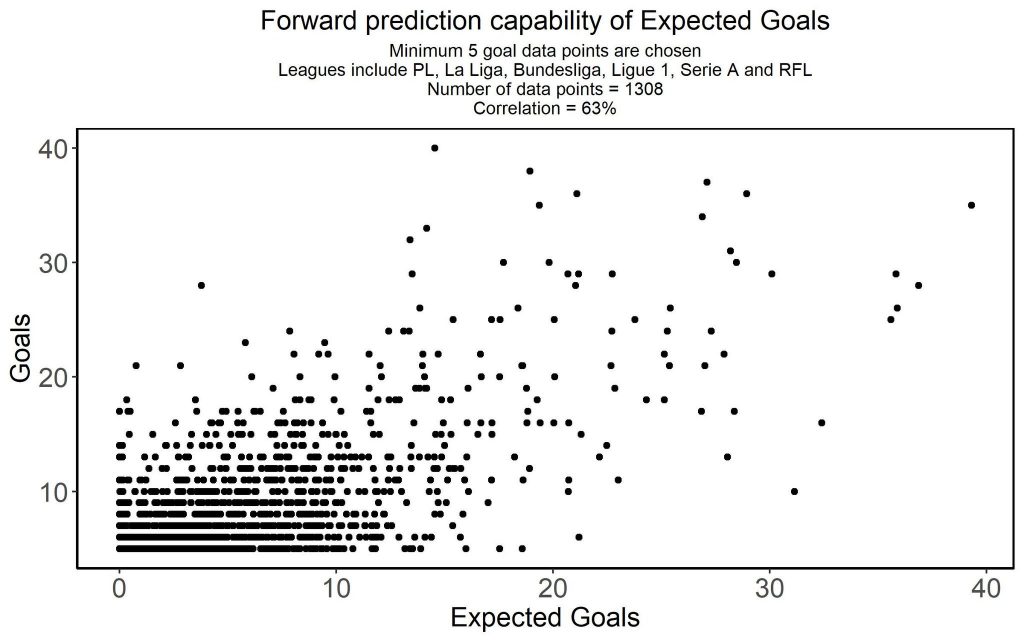
As you can see now that we are excluding the worst performing players in regards to scoring, the correlation drops from 68% to 63%. This trend continues the more low performing players we eliminate:

With at least 10 goals scored, the correlation drops to 58%.

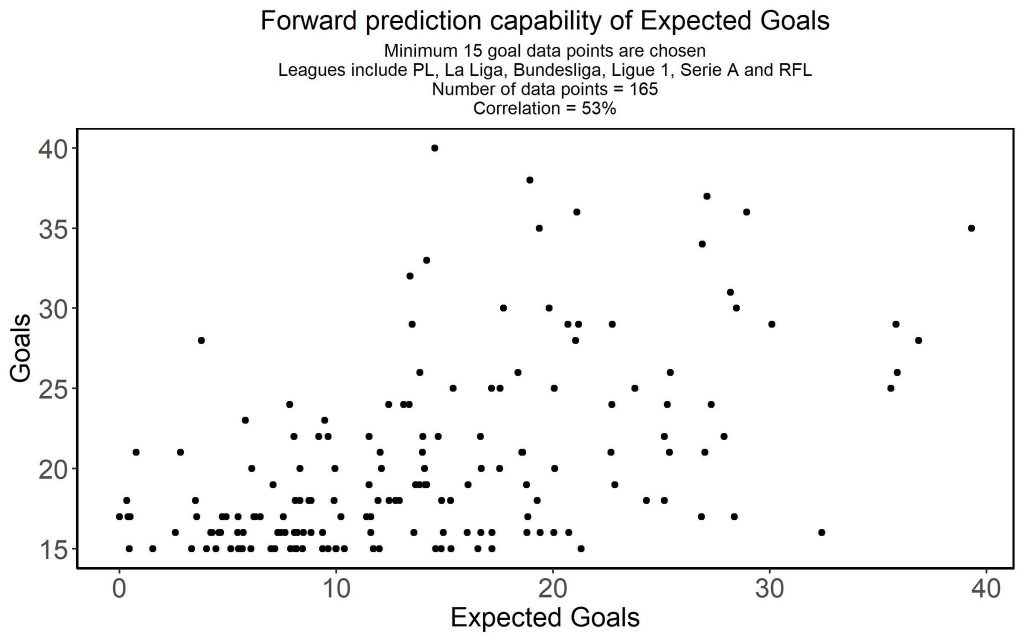
And with at least 15 goals scored the correlation drops to 53%. Now take a look again at the graphs that show how little information there is for a 50% correlation:

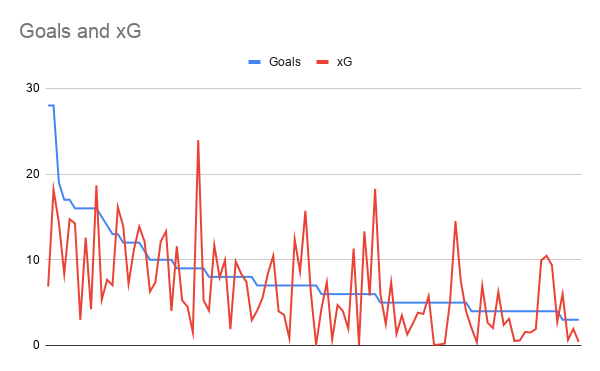
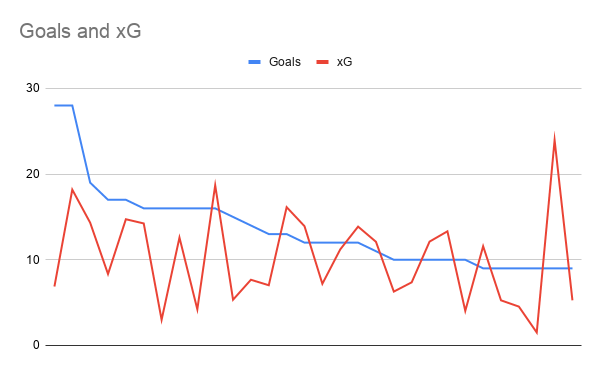
Here is a graph that makes it even more clear how the correlation with future goals decreases the better the player is:

Image

Also xG overperformance has a low correlation with future xG:

Image

So selecting players based on their current overperformance on xG stat is a bad strategy. If you look at future goals there is no correlation:

Image

xG in the Eredivisie

To remind you: Ashes has looked at the top 5 leagues and the Russian league. Personally, I am more interested in the smaller leagues, especially the Eredivisie. And I am more interested in whether it helps to use xG in concrete player recruitment, especially in finding exceptional players. At my work at FBM we have found the striker Dalmau for Heracles. Not only did Dalmau become the #3 top scorer that season, we also predicted that he would be worth 1.75 million in transfer fee for Heracles the next year and Heracles did receive 1.7 million for Dalmau (700K transfer fee and Dessers, a striker valued at 1 million).

So in order to see how xG correlates with goals in the next season, I looked at three very specific groups within the top 100 top scorers for the 18/19 season and calculated the correlations with xG (and some other stats to compare) from the 17/18 season. For the top 100 the result is a correlation of 48%. As correlation is nothing more than a measure of how much two lines look the same, it helps to actually look at the graph of the data:

As you can see even though the correlation is 48%, in reality there is very little information in this graph. A lot of the correlation found has to do with the fact that the goals scored is a very nice, well behaved line, which is logical given that the line is ordered by goals scored.

But things get even more interesting when we look at the top 30 rather than the top 100. Now the correlation of xG with goals in the next season drops to as little as 20%! Which you could already have seen in the previous chart, but becomes painfully obvious in the next chart:

As you can see there is no information to be found in this chart. 

In fact for the top 30, minutes played has a 37% correlation with goals scored the next season. To be clear, that is still way less than you need for decision making, but it puts to bed the idea that if you want top scoring players, you should look at xG. In fact our proprietary stat scores a 53% correlation for the top 30 top scorers of the Eredivisie, but again this is not enough for decision making.

Here is the table of the different stats I look at for the top 30, top 60 and top 100:

xG/90 xG SOT/90 SOT Minutes Goals scored in season
Top 30 7.43% 19.45% 1.47% 17.23% 36.66% 13.92%
Top 60 28.45% 36.68% 30.78% 33.33% 30.61% 23.68%
Top 100 39.90% 47.99% 37.36% 45.34% 30.09% 40.52%

As you can see it really makes little difference whether you look at xG or at Shots On Target (SOT). This further backs up the data found in the Scottish competition. From spot #62 on players have scored 5 or less goals in the Eredivisie. As you can see by adding low performing but highly correlated players to the population, you increase the correlation.

Now one criticism might be that the top 30 is too small. Although 30 sounds like a small sample size, 30 is often used as the minimal sample size. Sample size ought to reflect what we are looking for. When it comes to using xG for the recruitment of players, what clubs are looking for are players who can make a difference scoring wise. Preferably, clubs hire players who score a lot, but cost a little. Dalmau moved to Heracles transfer free. Clubs want players who score above average. Or in other words: clubs are looking for players who make it to the top 30! If they use xG to base their decision making on, they are going to make too many bad decisions.

Circularity

Yet, the story of xG and correlation becomes even worse. For we haven’t taken circularity into account. If you look at the formula for xG, all data providers have different ways of calculating xG. Nevertheless, it basically is:

xG = goals scored by shooting from position X / total shots from position X

If you look at the correlation between xG and goals, one needs to account for the circularity of it all. For goals are part of the formula in xG. Having the thing you calculate your correlations for as part of the formula you use to determine the correlate in the first place, creates circularity. Circularity means that the correlation will be a bit higher than it would have been without circularity. So all the above correlation for xG and goals scored the next season are overestimations due to circularity!

[Update 21-11-2022: I found out that there is no correlation between goals and xG. This is of course not a criticism as xG and goals aren’t meant to correlate as xG is an alternative way of trying to explain the match other than the actual goals. Nevertheless, it is note worthy that this means that xG has zero explanatory power in explaining goals.  To be clear: a high correlation between xG and goals would actually be bad for xG as xG is an alternative measure to explain the match than goals. If the correlation were to be high, it wouldn’t be an alternative.]

A bad map is better than no map at all

The final defense of xG by its proponents, is that xG might not have correlation that are high enough to give you useful information, but at least it is the best we can do. First of all, this is simply not the case. There are a number of examples, for instance the Scottisch Premier League, where Shots On Target did better. But even if it were the case, then it is still a fallacy.

This fallacy is called the “bad map is better than no map at all” fallacy. This is a fallacy because logically, you have a better chance of finding the correct way without a map, than with a bad map. A simple thought experiment we philosophers like so much, will demonstrate this.

Imagine you are in a maze and you have four different paths to go: north, east, south, west and two people. Person A without a map and person B with a bad map, even though he thinks, incorrectly, that he has a good map. If that is all we know, most people would give person A a chance of 25% of choosing the right path. But as it is highly likely that person B will choose the path that his map incorrectly highlights as the correct path. So the chance of person B actually choosing the right path is probably below 1%. Such is the danger of incorrect maps!
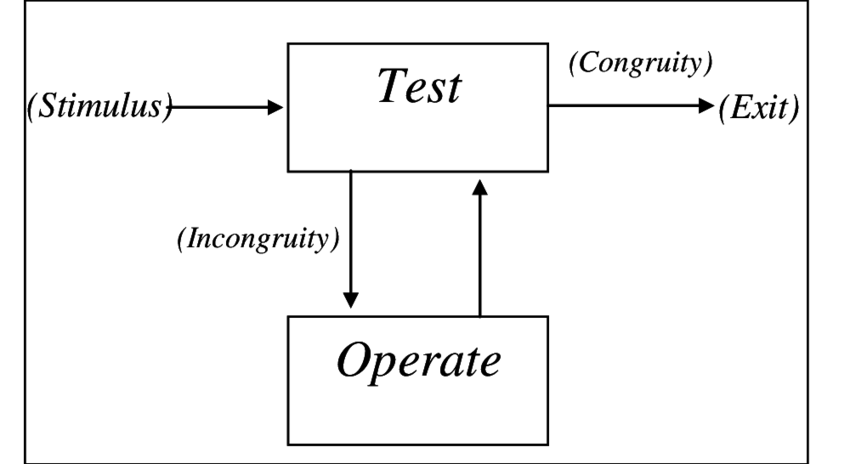
The solution

After describing so much of what is wrong with using xG for player recruitment, let me also explain a healthy alternative. Rather than using a single stat, one builds a Bayesian network that includes all sources at the club. Sources included all independent data sources, scouts, coaches, the manager, head of recruitment, technical director and the finance guys. Based on their inputs the Bayesian network calculates for all players in the shadow team what the probability is that player X is able to contribute to the team. And preferably also calculates how much money a club can probably make with a future transfer fee. Then the Bayesian network automatically orders all players in the shadow team to come up with the most rational decision when it comes to recruiting the right player.

PSxG

[Update 30-7-2020] What a difference nine months can make! The original post was written in october 2019. Since then xG has been uprooted by PSxG or Post Shot xG, also known as xG Shots on Target. As it turns out taking looking primarily only at the shots that were actually on the target, i.e. shots that either scored or would have scored if no opponent would have interfered, we get a more informative stat. 

This can for example be seen in the Premier League at the difference between xPoints based on xG and xPoints based on PSxG. xPoints are expected points scored in the league based on either xG or PSxG.

For xG it looks like this (table courtesy of https://twitter.com/ParthAthale) :

Rank Points xPoints based xG
Liverpool 1 99 74
ManCity 2 81 87
ManUnited 3 66 71
Chelsea 4 66 73
Leicester 5 62 61
Tottenham 6 59 49
Wolves 7 59 63
Sheffield 7 54 49
Arsenal 8 56 50
Burnley 10 54 49
Southampton 11 52 57
Everton 12 49 55
Newcastle 13 44 31
Crystal 14 43 38
Brighton 15 41 47
West Ham 16 39 38
Aston Villa 17 35 37
Bournemouth 18 34 39
Watford 19 34 47
Norwich 20 21 31

The correlation between rank is 84% and with points is 73%. The 84% correlation is above 80% so that is a decent correlation, but unfortunately for points the correlation is below 80% and hence not really informative.

If we do the same with PSxG rather than xG, we get (courtesey of https://twitter.com/StatifiedF ): 

Rank Points xPoints based on PSxG
Liverpool 1 99 89
ManCity 2 81 81
ManUnited 3 66 69
Chelsea 4 66 68
Leicester 5 62 65
Tottenham 6 59 49
Wolves 7 59 62
Sheffield 7 54 52
Arsenal 8 56 54
Burnley 10 54 51
Southampton 11 52 54
Everton 12 49 52
Newcastle 13 44 37
Crystal 14 43 31
Brighton 15 41 51
West Ham 16 39 41
Aston Villa 17 35 38
Bournemouth 18 34 38
Watford 19 34 38
Norwich 20 21 24

Now the correlation for rank is improved to 89% and for points it is 83%. Please, remember that correlation is a nonlinear function. So an increase from 73% to 83% is quite a feat and shows that PSxG is informative whereas xG is not in this case. 

Of course, it is easy to understand why PSxG is more informative than xG. One of the biggest criticisms to xG is the lack of context. By only looking at shots that are on target, we add more context. Also, the Scottish result discussed above shows that Shots on Target already outperformed xG on some occasions even though xG proponents fanatically vowed that no stat outperformed xG. So combining Shots on Targets with xG should improve the performance as it indeed does in our example.

Nevertheless, by including even more context as we do in our Bayesian model, you get even higher correlations. The context that we add is the following data from Wyscout. Please note that we do not include xG or any other expected something stat.

  • Average goals scored
  • Average goals conceded
  • Shots off Target
  • Shots on Target
  • Passes inaccurate
  • Passes accurate
  • Recoveries (low, medium, high)
  • Losses (low, medium, high)
  • Challenges failed
  • Challenges won

 If we use our Bayesian model we get the following table:

Rank Points FBM Wyscout score
Liverpool 1 99 84
ManCity 2 81 92
ManUnited 3 66 80
Chelsea 4 66 75
Leicester 5 62 80
Tottenham 6 59 63
Wolves 7 59 68
Sheffield 7 54 60
Arsenal 8 56 68
Burnley 10 54 41
Southampton 11 52 41
Everton 12 49 51
Newcastle 13 44 37
Crystal 14 43 43
Brighton 15 41 52
West Ham 16 39 42
Aston Villa 17 35 44
Bournemouth 18 34 40
Watford 19 34 38
Norwich 20 21 38

This time the correlation with rank is improved to 93% and with points to 90%. This goes to show that although PSxG is an improvement over xG, it is not the end of all things. By using a completely different approach than an expectation stat, one gets better results.